
Sunburst Chart Features
Sunburst charts are designed to illuminate hierarchical data. See all major features of our Sunburst Chart Extension for Qlik Sense in this Qlik demo app.
Sunburst Chart Features


About this app
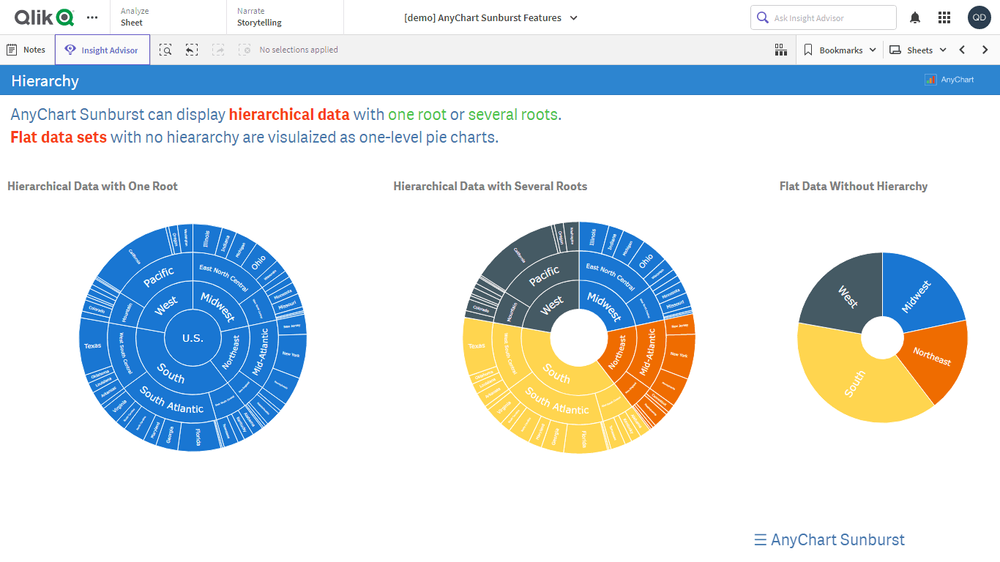
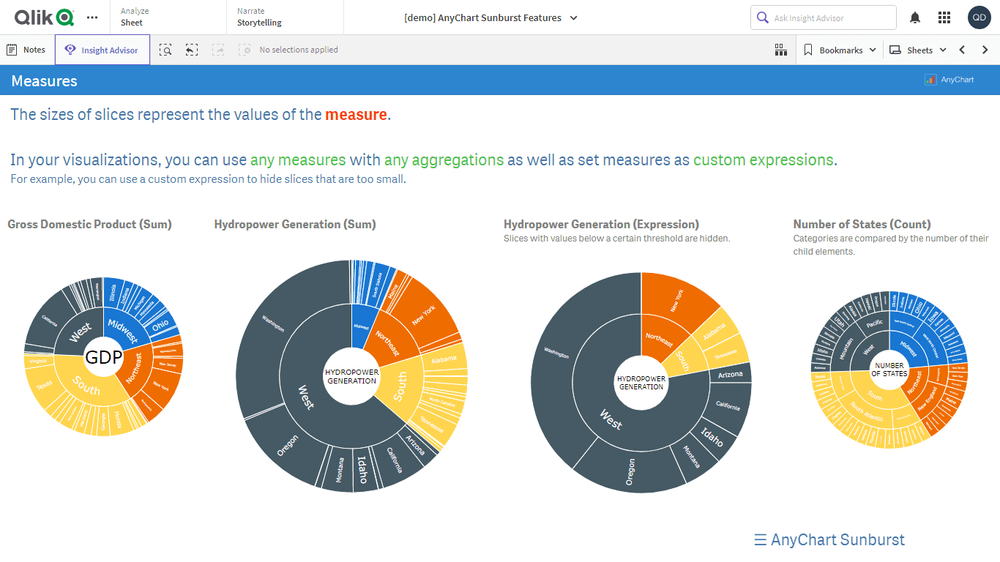
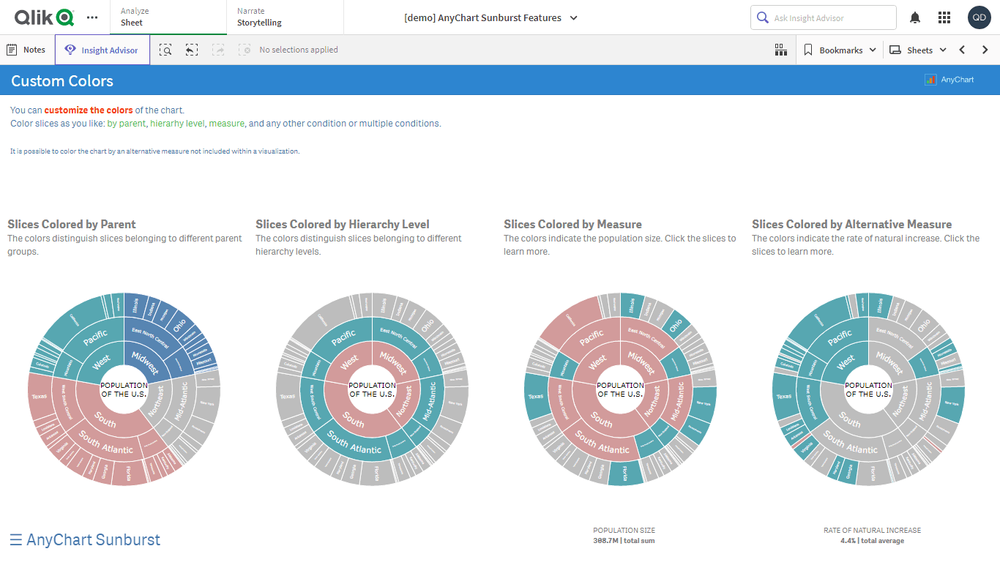
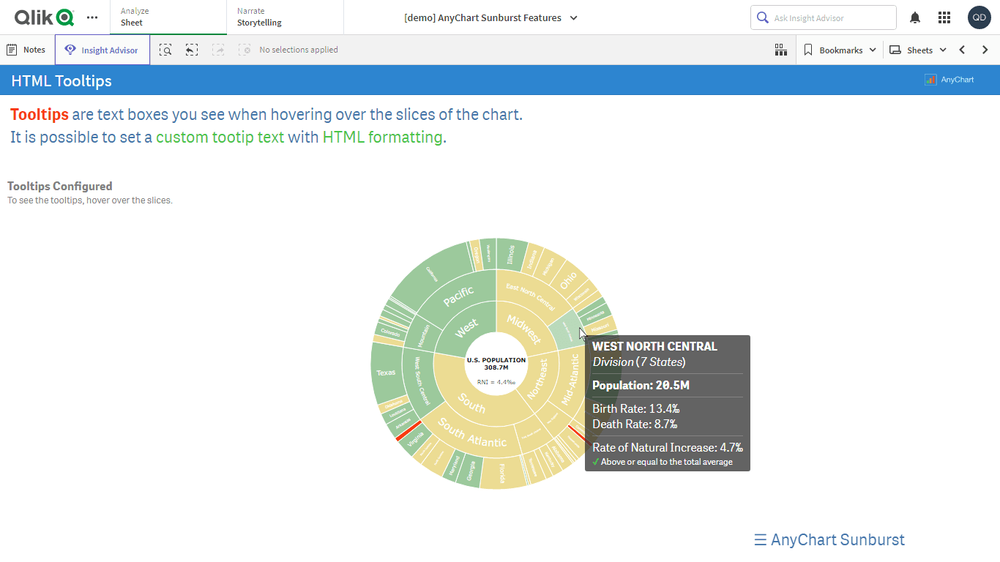
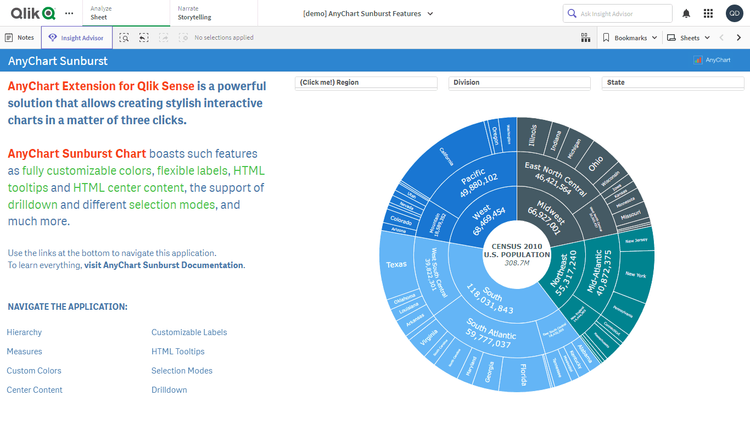
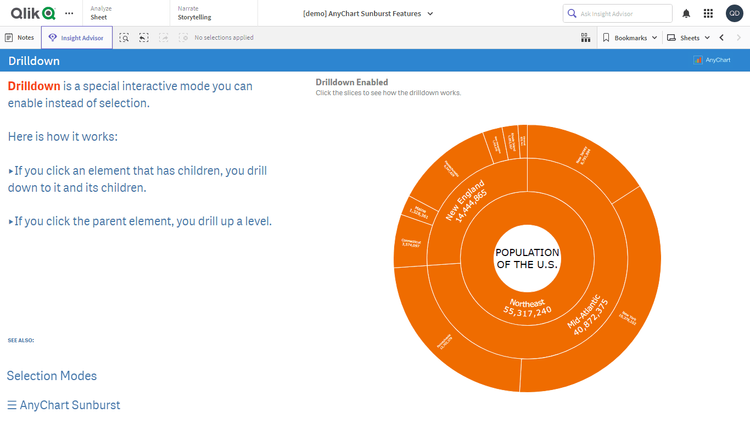
Sunburst charts are designed to represent hierarchical data through a set of sliced concentric rings. Looking at a visualization of real U.S. population data from the 2010 Census, explore all major features of our intuitive Sunburst Chart Extension for Qlik Sense. See flexible labels, custom colors, drilldown, center content, HTML tooltips, multiple ways to show the hierarchy and measures, and much more demonstrated in action.
This application features a Sunburst Chart built with the Sunburst Chart extension for Qlik Sense. Data: 2010 U.S. Census.