
ميزات Waterfall Chart
استكشف جميع الميزات الرئيسية لامتداد Waterfall Chart لـ Qlik Sense في هذا التطبيق التجريبي: أوضاع بيانات مختلفة، فئات فرعية مكدّسة، والمزيد.
ميزات Waterfall Chart


حول هذا التطبيق
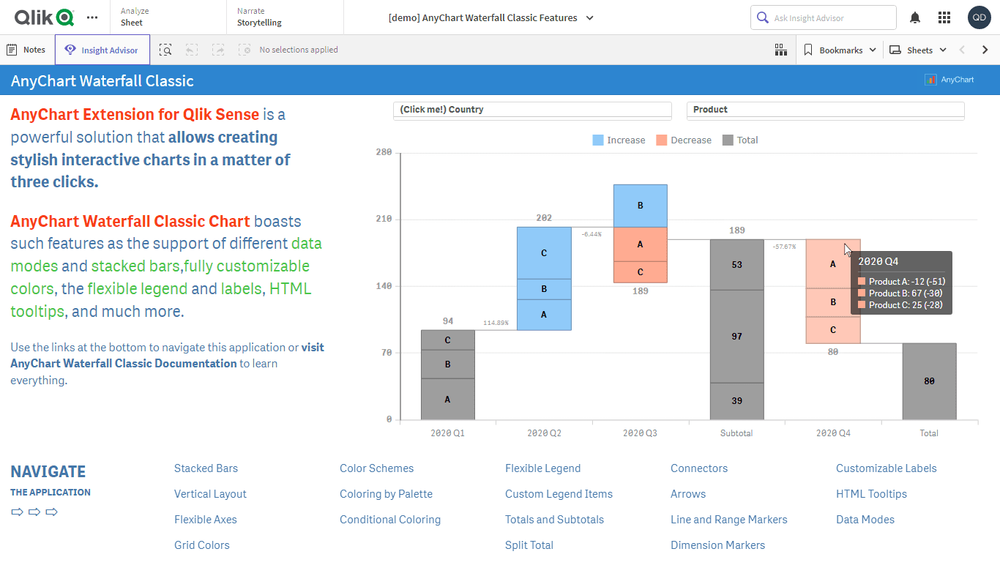
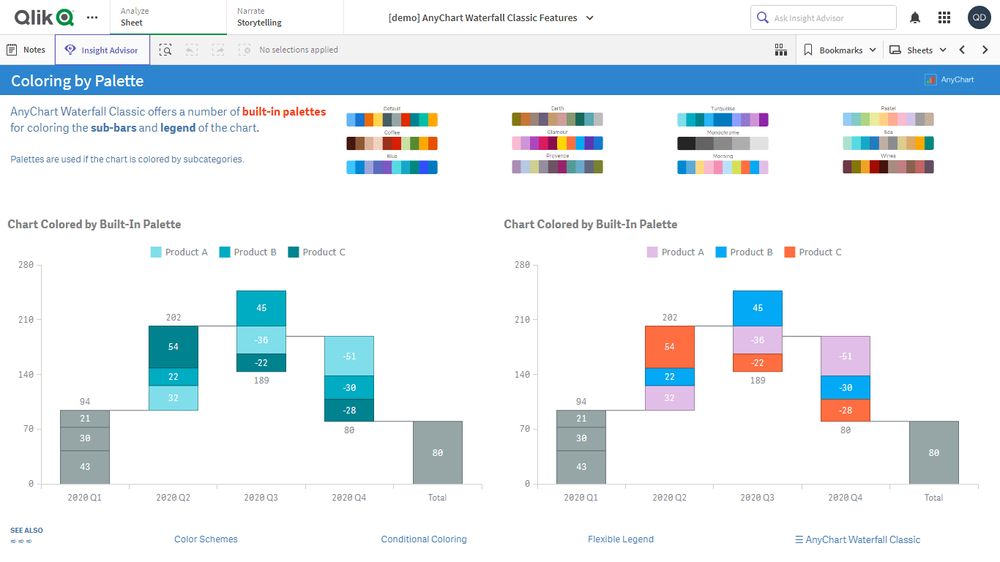
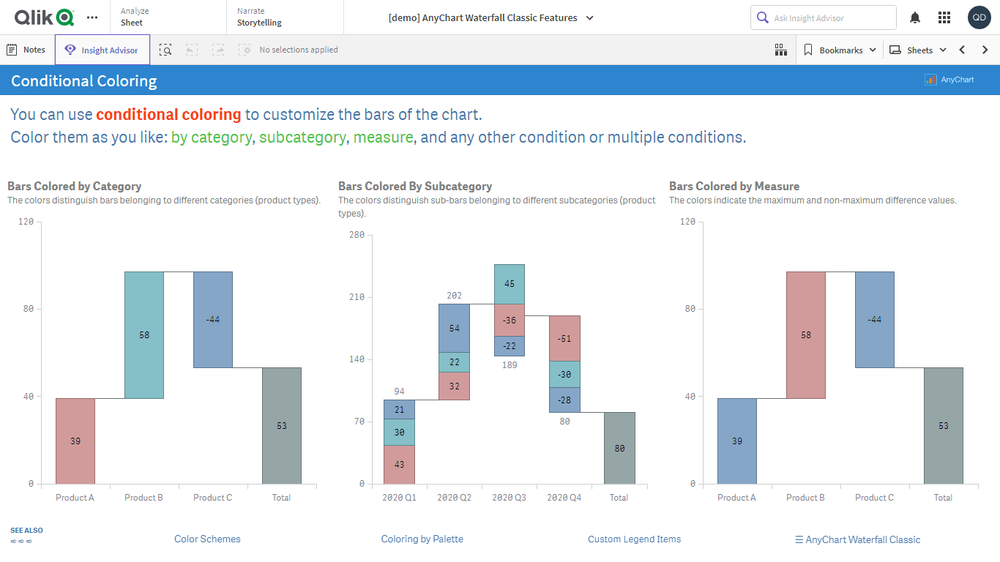
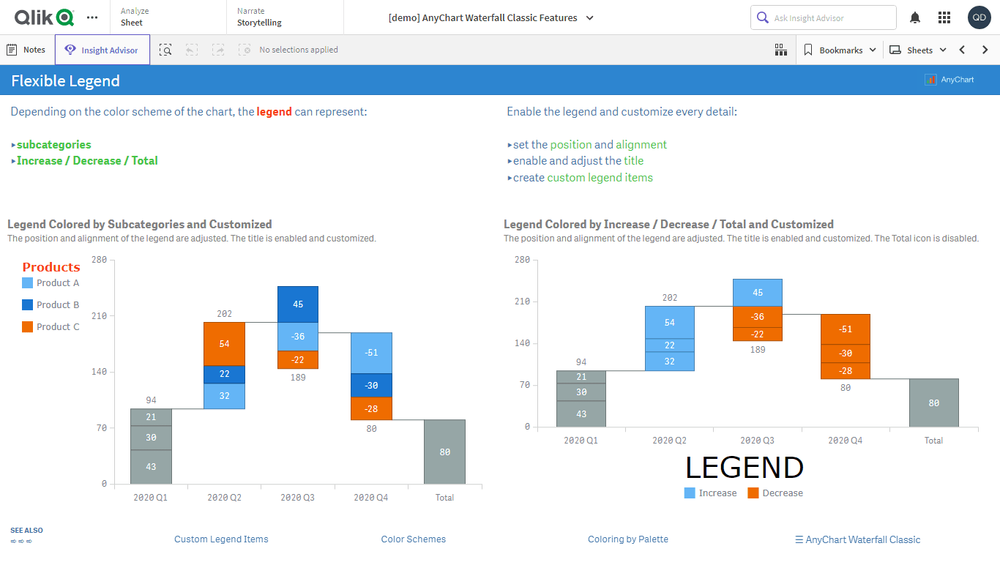
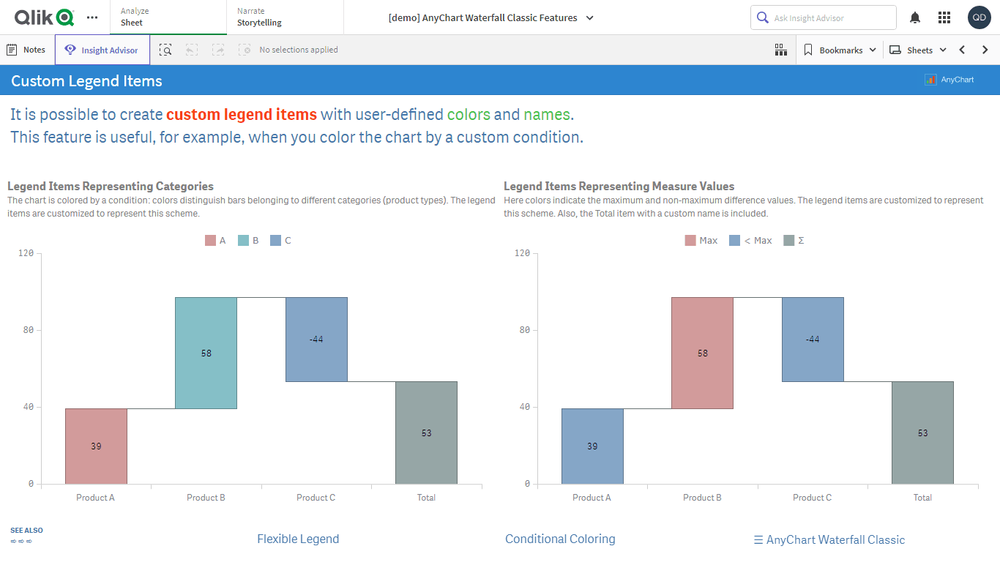
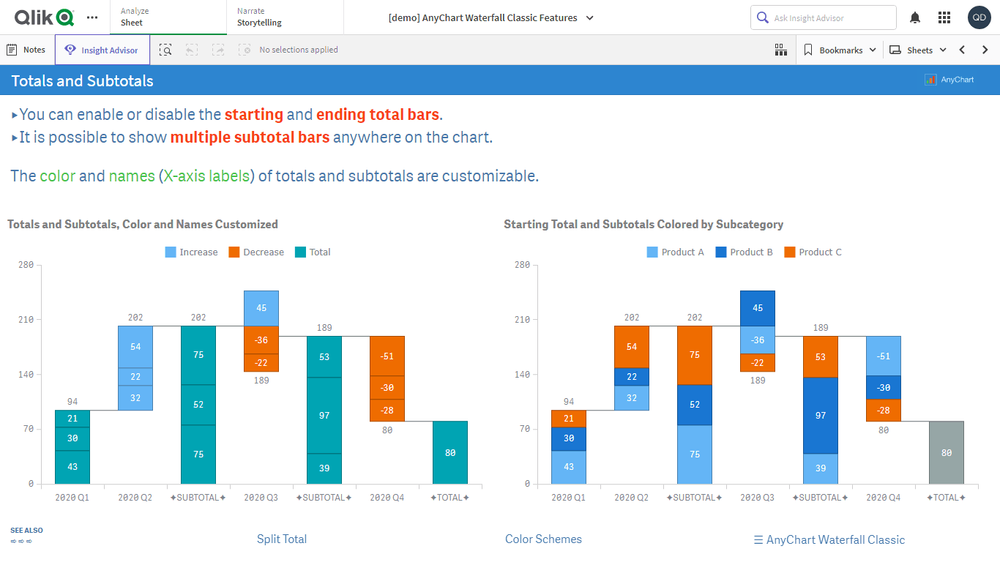
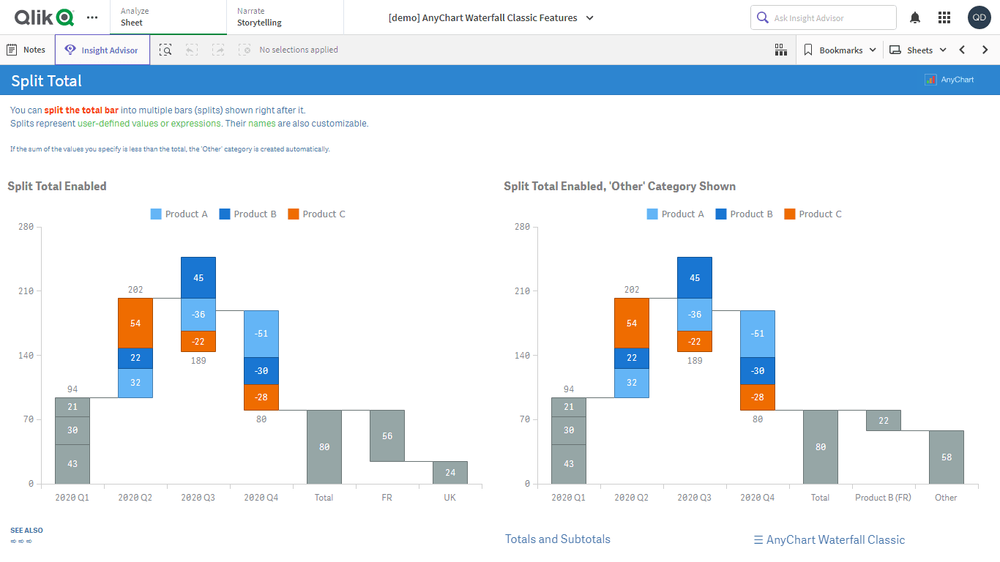
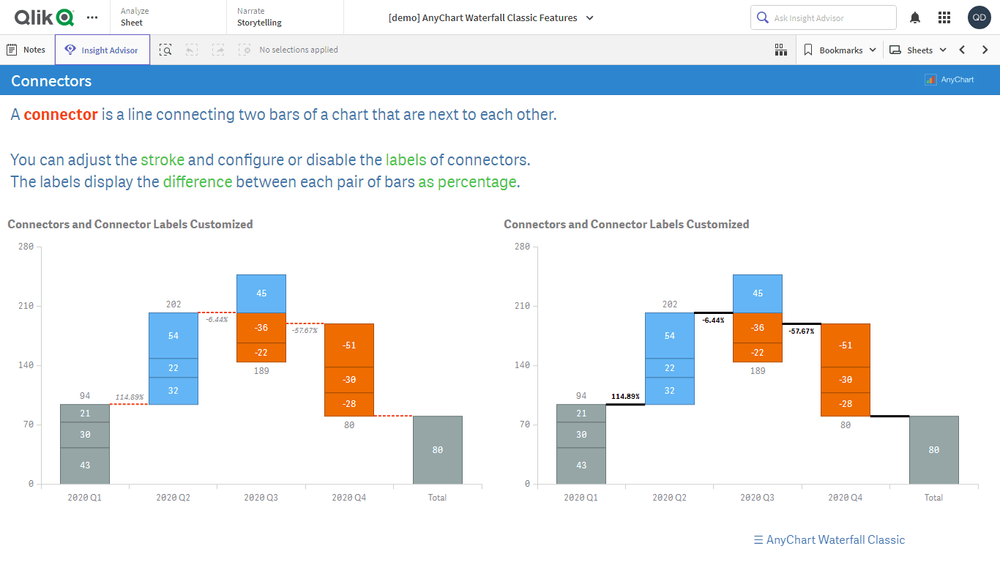
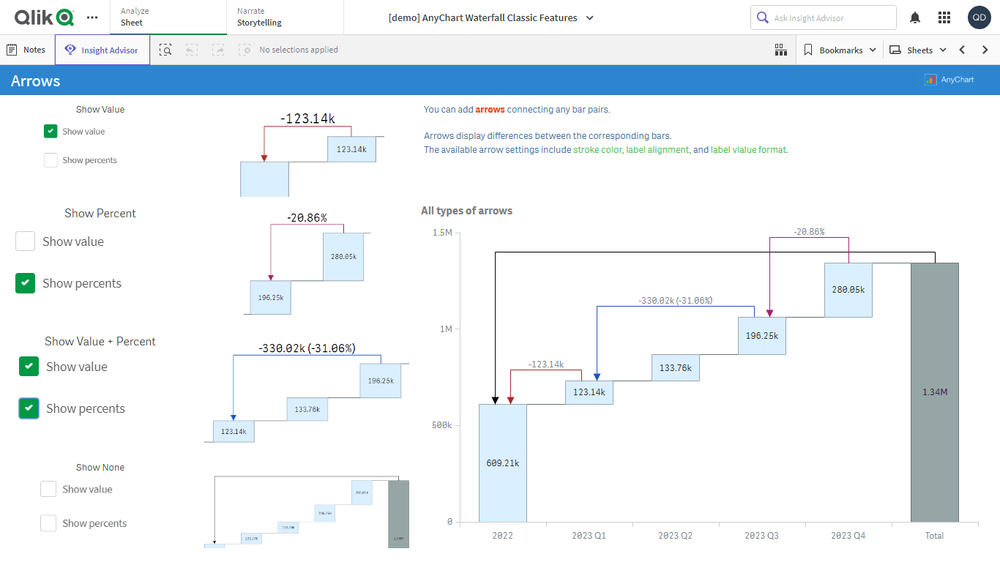
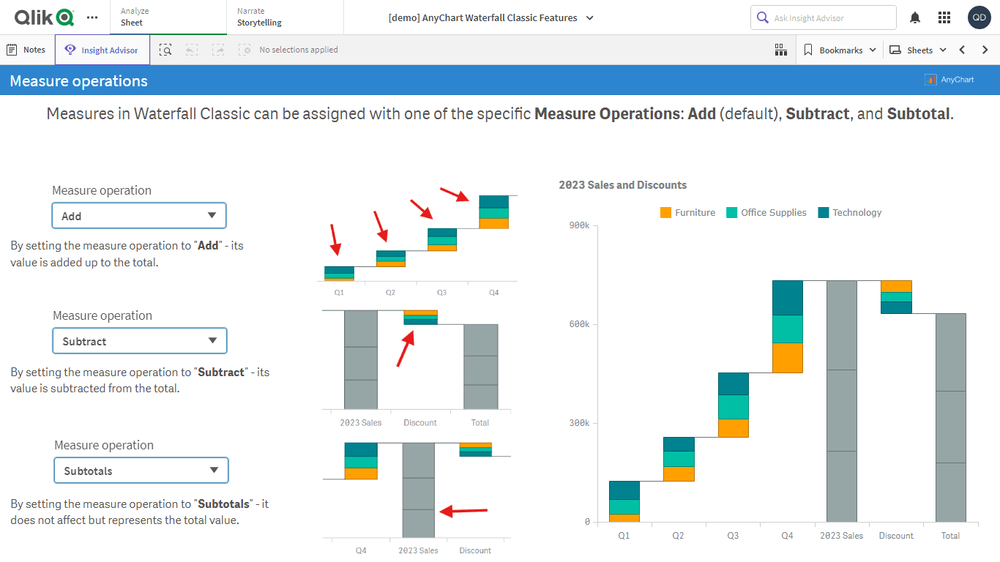
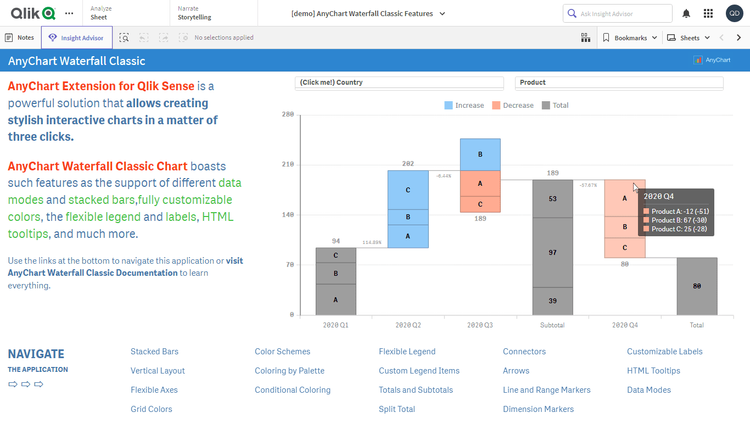
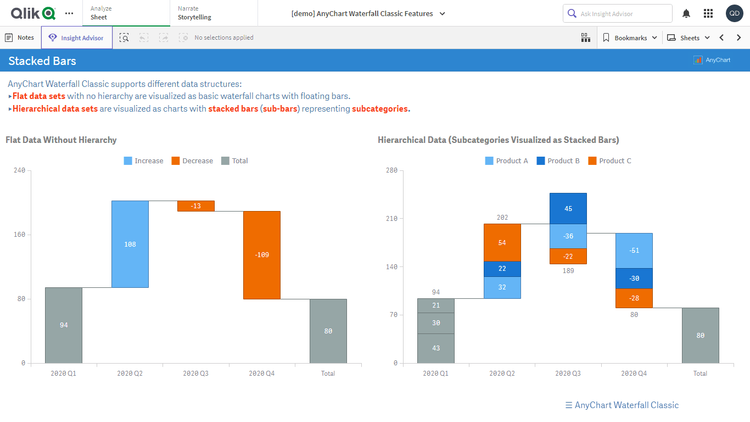
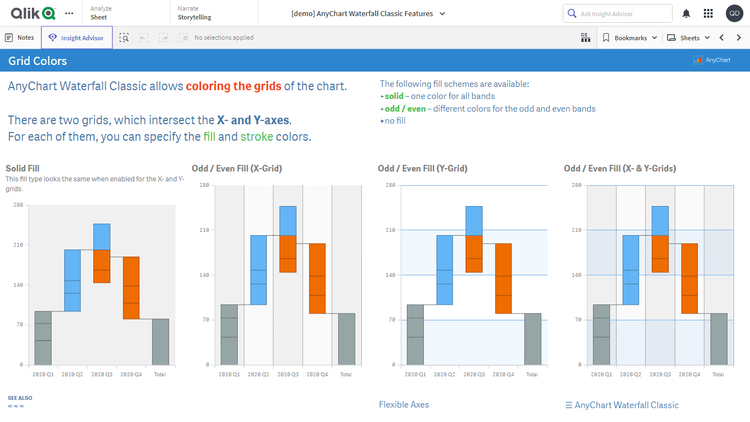
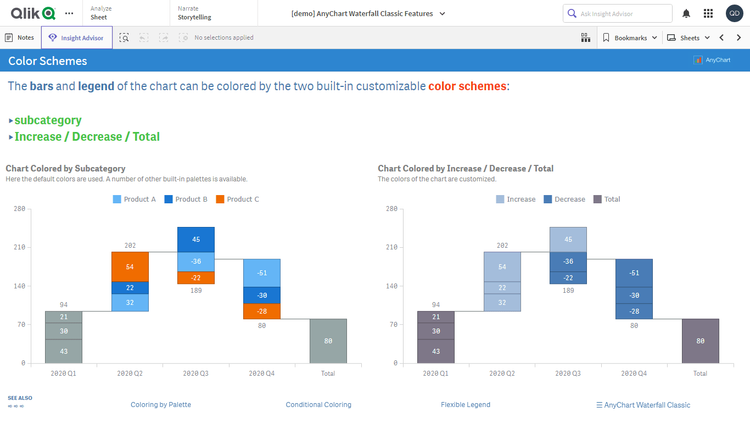
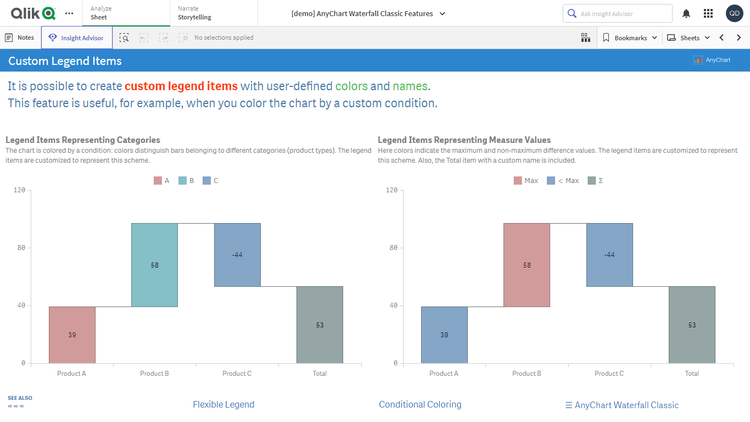
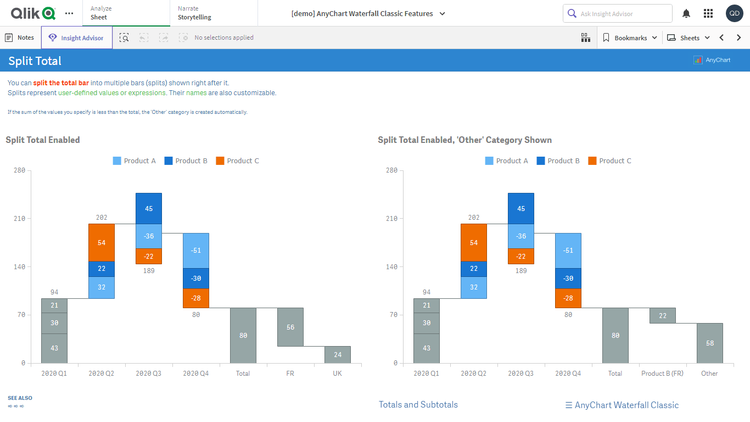
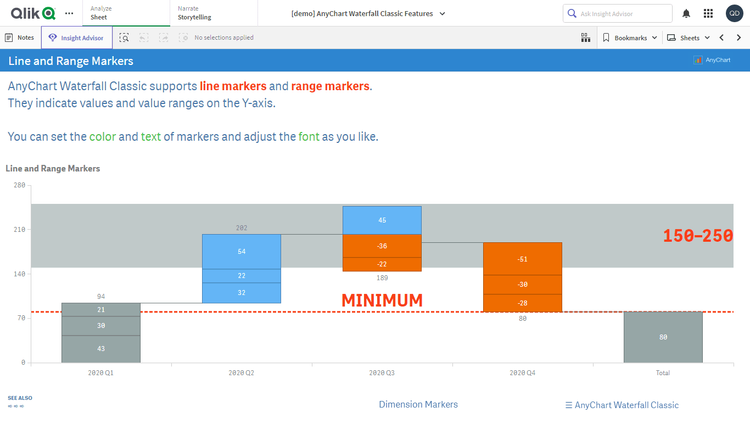
تُظهر مخططات Waterfall Chart الأثر التراكمي للقيم المضافة والمطروحة بالتتابع. وأثناء استعراض تصور خيالي لمؤشرات المنتجات، يمكنك استكشاف جميع الميزات الرئيسية لامتدادنا البديهي Classic Waterfall Chart Extension لـ Qlik Sense، والذي يدعم نطاقًا أوسع من الخيارات مقارنةً بالحل الافتراضي في Qlik. شاهد أوضاع البيانات المختلفة، والفئات الفرعية المكدّسة، وخيارات التلوين القابلة للتخصيص، والمحاور المرنة، وغير ذلك الكثير معروضًا في التطبيق.
يتميز هذا التطبيق بوجود Classic Waterfall Chart مبني باستخدام امتداد AnyChart لـ Qlik Sense. مجموعة البيانات خيالية.