
ميزات Sunburst Chart
تم تصميم مخططات Sunburst Chart لإبراز البيانات الهرمية. استكشف جميع الميزات الرئيسية لامتداد Sunburst Chart لـ Qlik Sense في هذا التطبيق التجريبي.
ميزات Sunburst Chart


حول هذا التطبيق
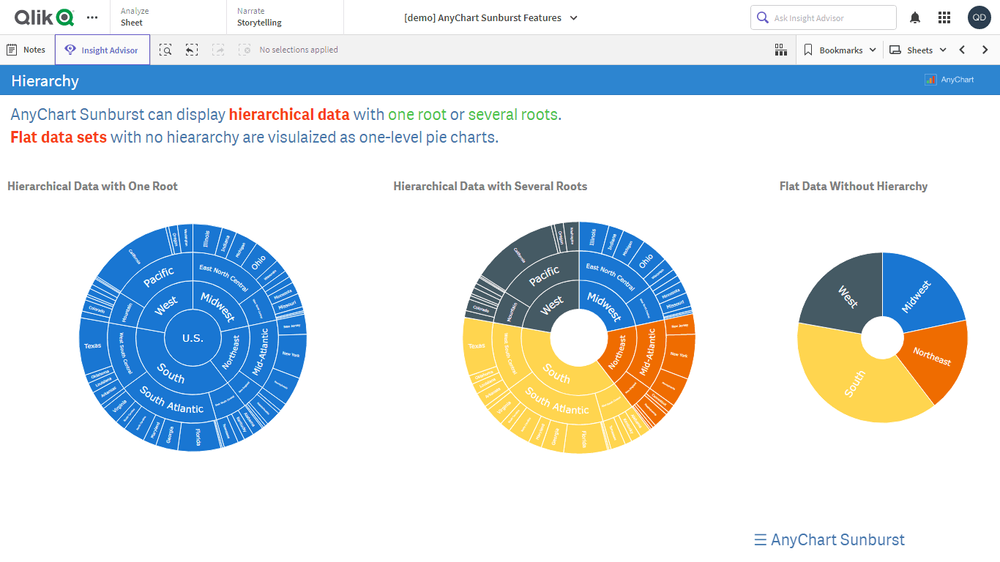
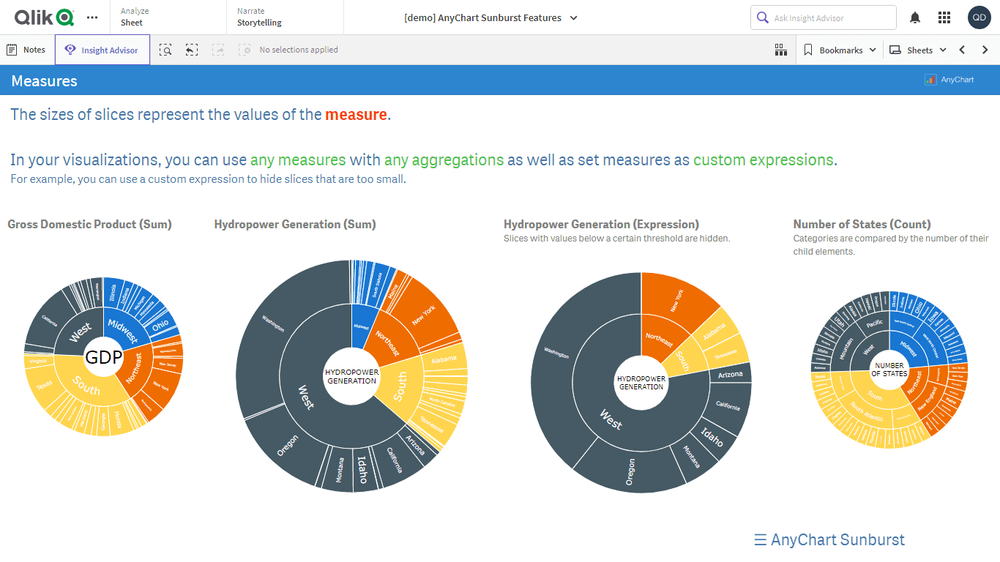
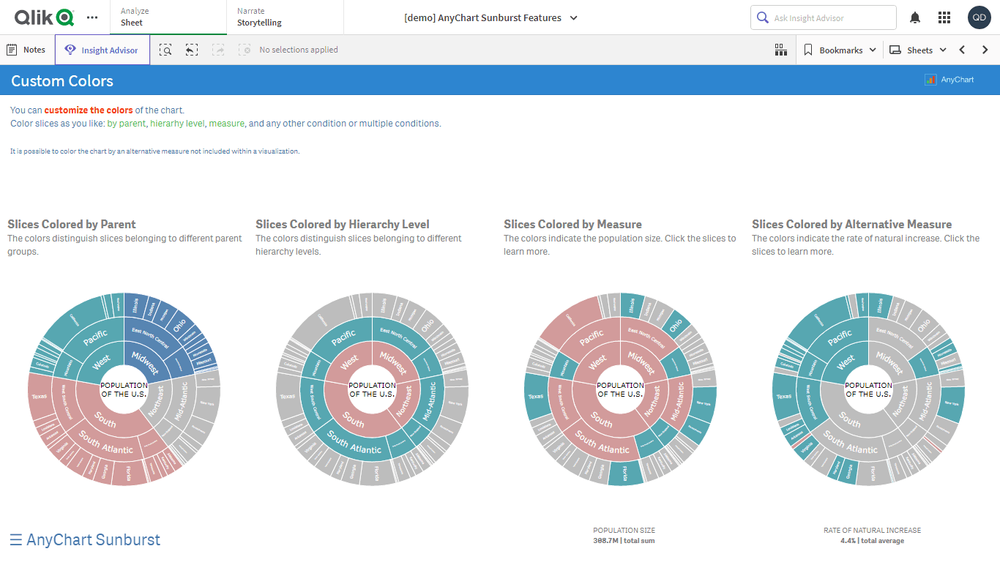
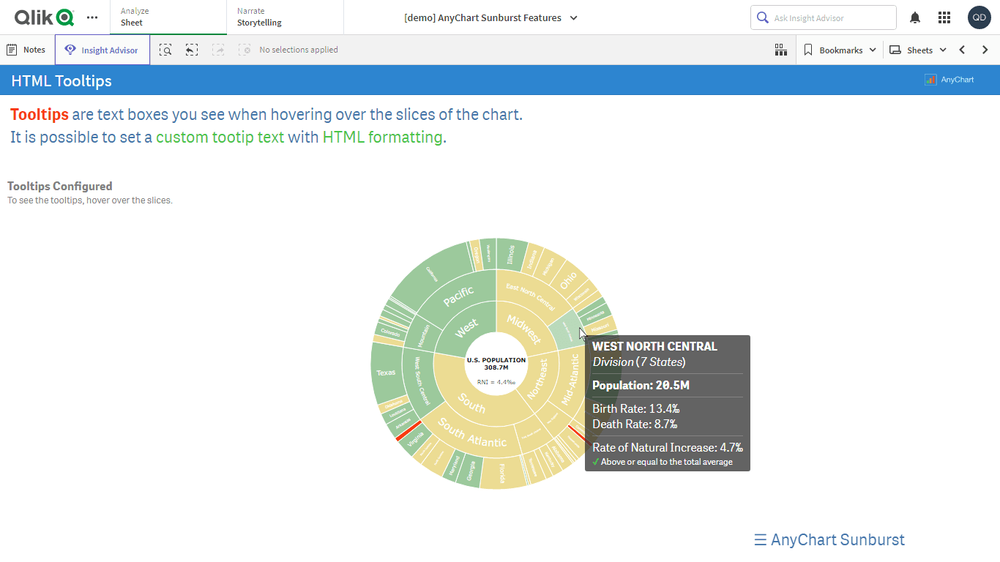
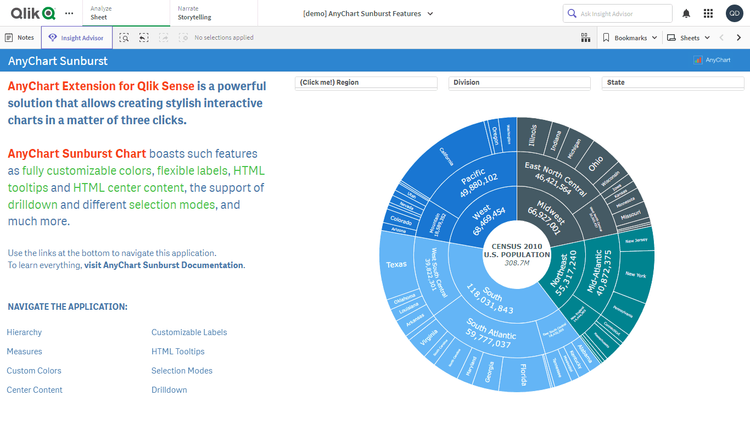
تم تصميم مخططات Sunburst Chart لتمثيل البيانات الهرمية من خلال مجموعة من الحلقات الدائرية المقطّعة. وأثناء استعراض تصور لبيانات التعداد السكاني في الولايات المتحدة لعام 2010، استكشف جميع الميزات الرئيسية لامتدادنا البديهي Sunburst Chart Extension لـ Qlik Sense. شاهد التسميات المرنة، والألوان المخصصة، والتنقل التفصيلي Drilldown، والمحتوى في المركز، والنصوص التوضيحية HTML Tooltips، وطرق عرض متعددة للتسلسل الهرمي والمؤشرات، وغير ذلك الكثير معروضًا في التطبيق.
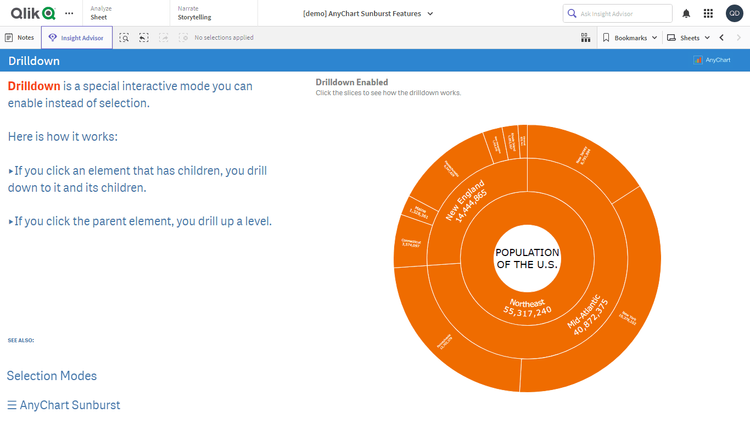
يتميز هذا التطبيق بوجود Sunburst Chart مبني باستخدام امتداد AnyChart لـ Qlik Sense. البيانات: تعداد الولايات المتحدة لعام 2010.