
ميزات Bullseye Chart
تُستخدم مخططات Bullseye Chart بشكل شائع لعرض خطوط الإنتاج (الأدوية). استكشف جميع الميزات الرئيسية لامتداد Bullseye Chart لـ Qlik Sense في هذا التطبيق التجريبي
ميزات Bullseye Chart


حول هذا التطبيق
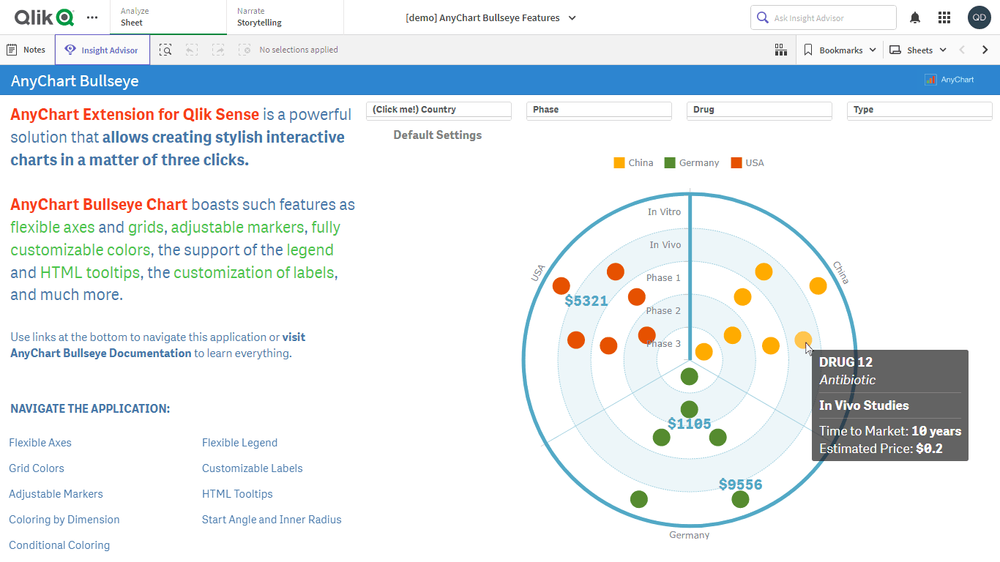
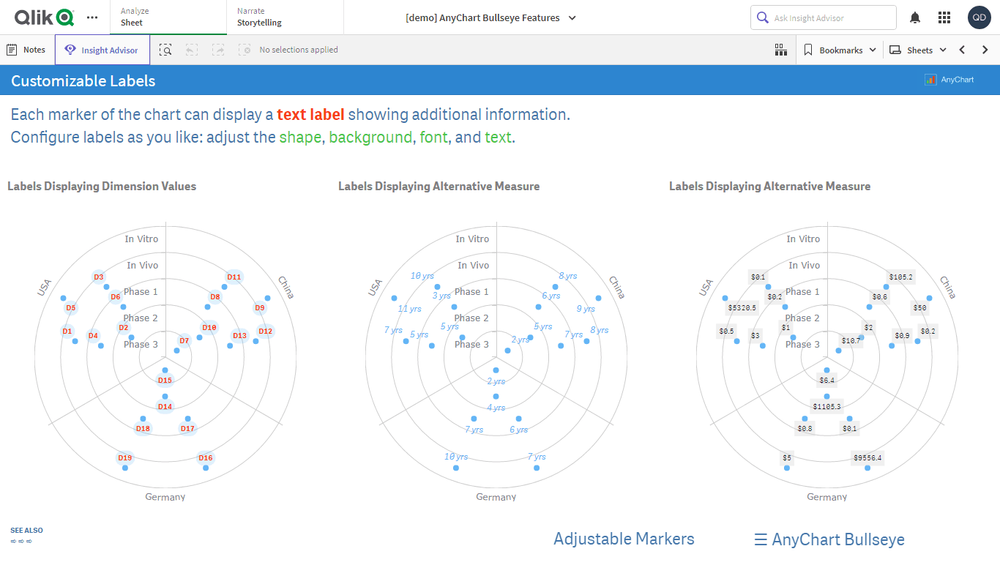
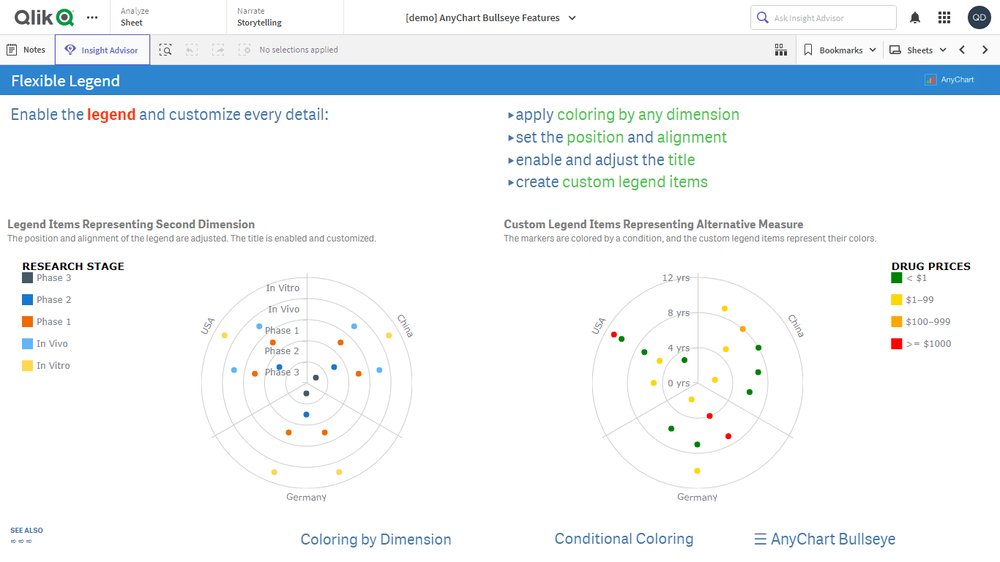
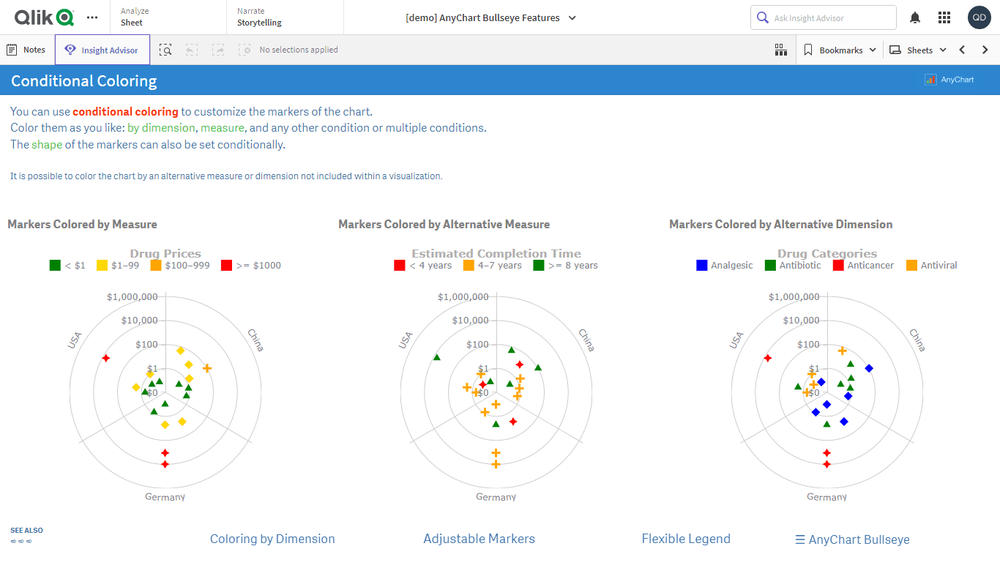
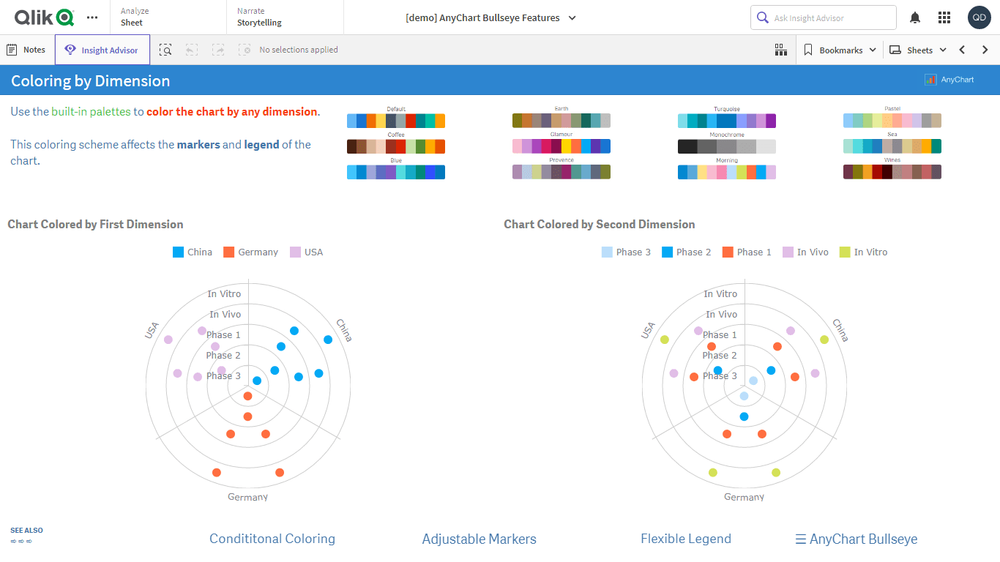
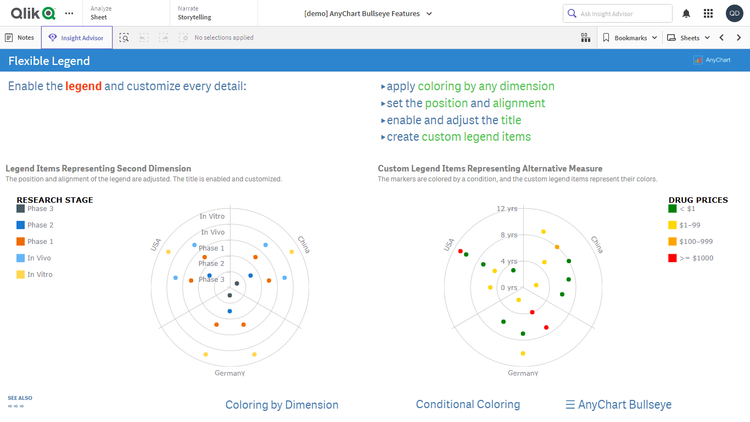
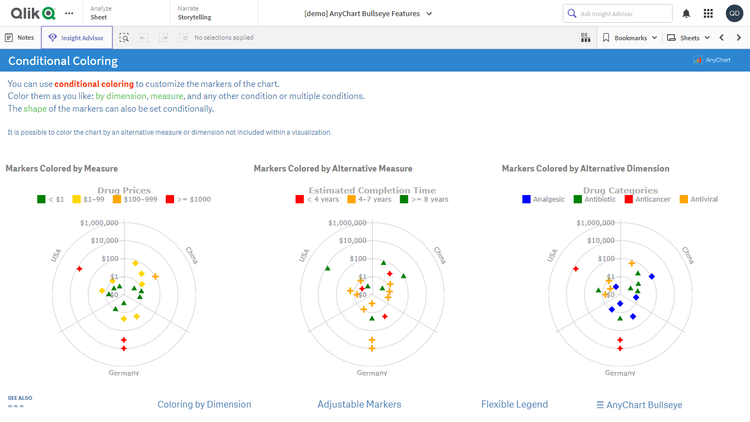
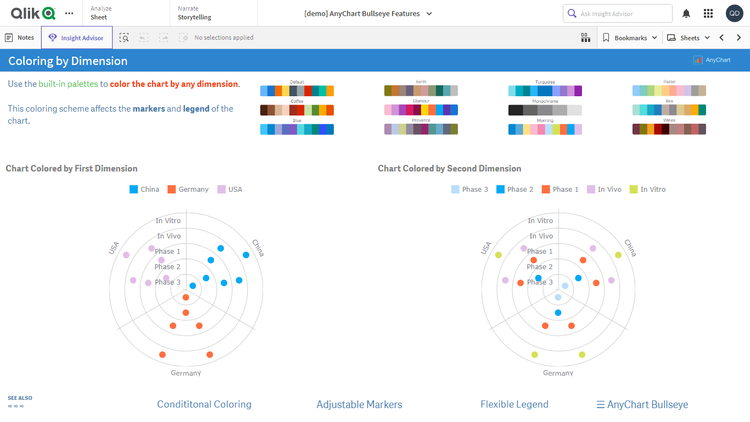
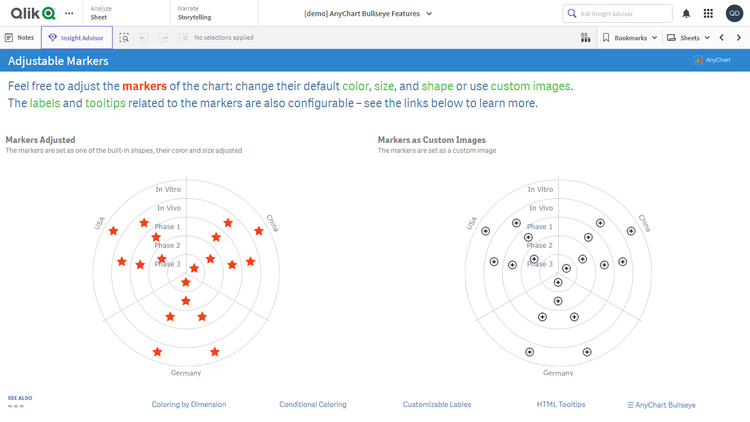
تُستخدم مخططات Bullseye Chart على نطاق واسع لعرض خطوط المنتجات بطريقة واضحة وموجزة. استكشف جميع الميزات الرئيسية لامتدادنا البديهي Bullseye Chart Extension لـ Qlik Sense أثناء استعراضك لخط إنتاج دوائي خيالي يُظهر بصريًا كيفية تقدم التجارب السريرية عبر المراحل المختلفة. شاهد المحاور والشبكات المرنة، والتسميات والمؤشرات القابلة للتخصيص، والتلوين الشرطي، والنصوص التوضيحية HTML Tooltips، وغير ذلك الكثير معروضًا في التطبيق.
يتميز هذا التطبيق بوجود Bullseye Chart مبني باستخدام امتداد AnyChart لـ Qlik Sense. مجموعة البيانات خيالية.